K-means is an unsupervised learning method for clustering data points. The algorithm iteratively divides data points into K clusters by minimizing the variance in each cluster. Here, we will show you how to estimate the best value for K using the elbow method, then use K-means clustering to group the data points into clusters.
A K-means Example Using Sklearn
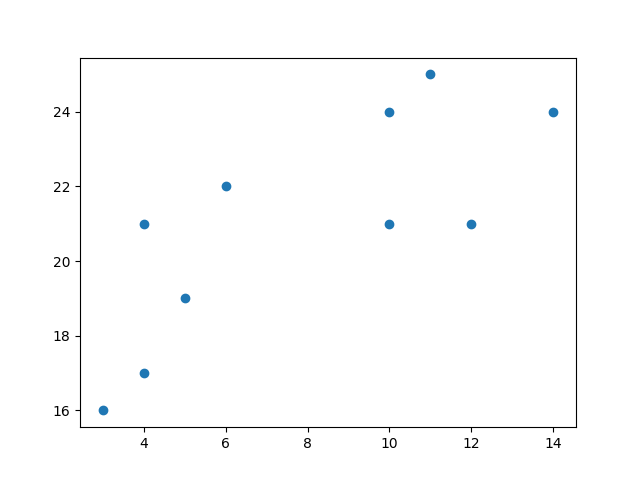
K-means clustering requires us to select K, the number of clusters we want to group the data into:
- Each data point is randomly assigned to one of the K clusters.
- Compute the centroid (functionally the center) of each cluster, and reassign each data point to the cluster with the closest centroid.
- Repeat this process until the cluster assignments for each data point are no longer changing.
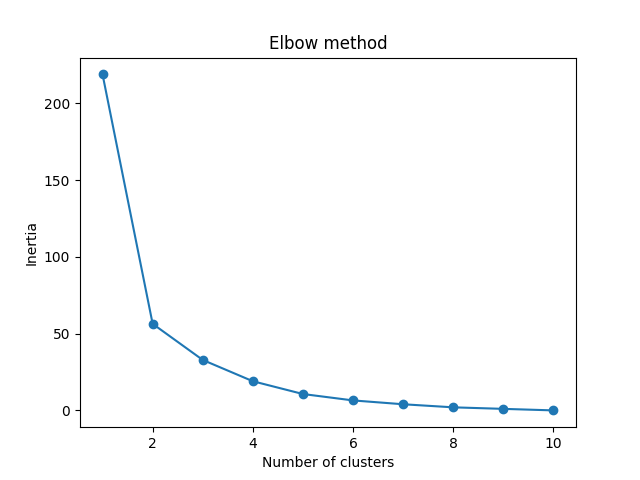
elbow method lets us graph the inertia (a distance-based metric) and visualize the point at which it starts decreasing linearly.
This point is referred to as the “eblow” and is a good estimate for the best value for K based on our data.
The code does not work for the Web since Python is not a client-side language.
To see a working example, check the W3Schools.
|
|
|
|||
|
|
|
|||
|
|||||
|
|||||

|
When people tell me “You’re gonna regret that in the morning.” I sleep till noon because I’m a problem solver. |